This track displays biosample-specific candidate cis-regulatory elements (cCREs)
alongside genome-wide epigenomic signals for the ENCODE Core Collection of 18
ENCODE biosamples. Each biosample contains five subtracks:
cCREs - biosample-specific cCRE classifications (see cCRE classification color key in the Display Conventions section below)
DNase - DNase-seq identifies regions of open chromatin commonly associated with enhancers, promoters, and insulators (shown in green)
H3K4me3 - ChIP-seq for H3K4me3 marks active and poised promoters and enhancers (shown in red)
H3K27ac - ChIP-seq for H3K27ac marks active and poised promoters and enhancers (shown in yellow)
CTCF - CTCF ChIP-seq identifies chromatin loop anchors and insulator elements (shown in blue)
Note: the colors used for the four signal subtracks are independent from the
cCRE classification colors shown in the Display Conventions section below.
Additional epigenomic datasets are available at the ENCODE portal, and further exploration
of cCREs and their supporting data is available through the SCREEN web tool, accessible via the
track details page.
Display Conventions and Configurations
Click a specific biosample type and organ/tissue
combination to view available datasets. Signal subtracks can be further
filtered by the signal type.
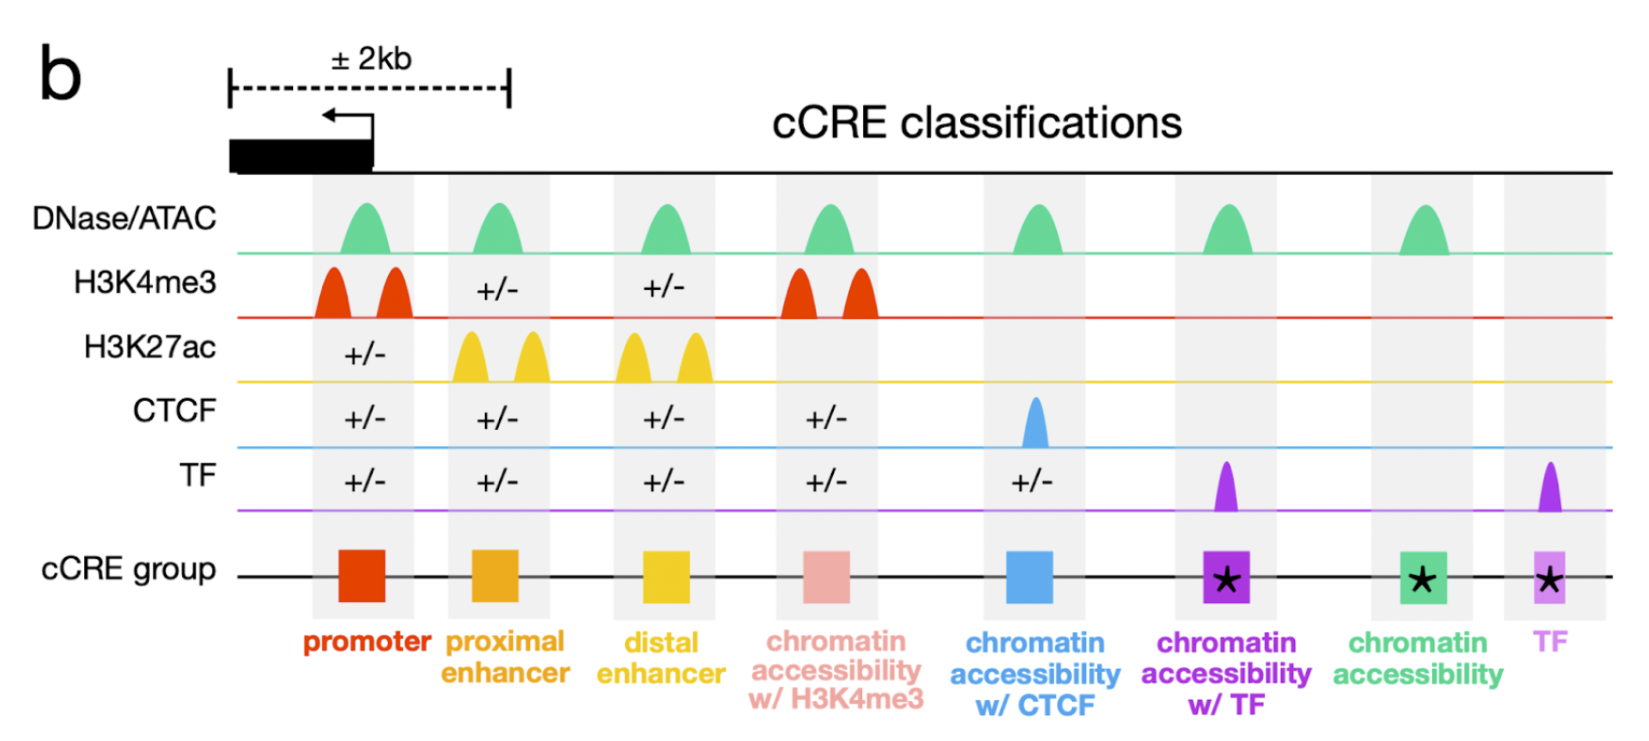
Each cCRE in the biosample-specific cCREs subtrack is color-coded by its classification type:
Promoter-like signatures (promoter) in red
must fall within 200 bp of a TSS and have high chromatin accessibility and H3K4me3 signals.
TSS-proximal enhancer-like signatures (proximal enhancer) in orange
have high chromatin accessibility and H3K27ac signals and are within 2 kb of an annotated TSS.
If they are within 200 bp of a TSS, they must also have low H3K4me3 signal.
TSS-distal enhancer-like signatures (distal enhancer) in yellow
have high chromatin accessibility and H3K27ac signals and are farther than 2 kb from an annotated TSS.
Chromatin accessibility + H3K4me3 (CA-H3K4me3) in pink
have high chromatin accessibility and H3K4me3 signals but low H3K27ac signals and do not fall within 200 bp of a TSS.
Chromatin accessibility + CTCF (CA-CTCF) in blue
have high chromatin accessibility and CTCF signals but low H3K4me3 and H3K27ac signals.
Chromatin accessibility + transcription factor (CA-TF) in dark purple
have high chromatin accessibility, low H3K4me3, H3K27ac, and CTCF signals, and are bound by a transcription factor.
Chromatin accessibility only (CA-only) in green
have high chromatin accessibility and low H3K4me3, H3K27ac, and CTCF signals.
Low-DNase in gray,
indicating the cCRE is inactive in this biosample.
The following graphic summarizes the cCRE classification criteria:
Mousing over an item displays the element ID with a linkout to SCREEN, the cCRE class,
and the biosample-specific Z-scores for DNase, H3K4me3, H3K27ac, and CTCF. A Z-score above 1.64 is considered
"high" signal, while a score of 1.64 or below is considered "low" signal
for classification purposes (Moore et al., 2026).
In addition to the cell type-agnostic classification (described in the cCRE Registry track
in this collection), the biochemical activity of each cCRE was evaluated in individual
biosamples using the corresponding biosample-specific DNase, H3K4me3, H3K27ac, and CTCF data.
Active cCREs in each biosample are displayed in the cCRE subtrack. cCREs with low DNase
Z-scores in a given biosample are considered inactive and labeled "Low-DNase."
The Core Collection includes only the four core assays standardized across all 18 biosamples:
DNase, H3K4me3, H3K27ac, and CTCF. ATAC-seq signal tracks for select biosamples are available
in the ENCODE4 Regulation track.
The data on the UCSC Genome Browser can be explored interactively with the
Table Browser or the
Data Integrator.
For automated download and analysis, the genome annotation is stored at UCSC in bigWig and bigBed
files that can be downloaded from
our download server.
The cCREs tracks in this data are found as bigBed files, and the biosignal tracks as bigWig files.
See the Data format link besides the specific data track for a URL to the file on our download
server. Individual
regions or the whole genome annotation can be obtained using our tools bigWigToWig
or bigBedToBed which can be compiled from the source code or downloaded as a precompiled
binary for your system. Instructions for downloading source code and binaries can be found
here.
The tools can also be used to obtain features confined to a given range, e.g.,
Data were generated by the ENCODE Consortium. We thank the production labs for generating
the data: Drs. Bing Ren (UCSD), John Stamatoyannopoulos (UW), Michael Snyder (Stanford),
Richard Myers (HAIB). The data were further processed for visualization through a collaborative
effort between the Weng lab and the Moore lab at UMass Chan Medical School
(funded by NIH grant HG012343). Integration and visualization were developed by Drs. Mingshi Gao,
Jill Moore, and Zhiping Weng at UMass Chan Medical School, who were part of the ENCODE Data
Analysis Center.